Last modified: June 3, 2026
Sales by product reports
Providers
The Sales by product report gives stores more visibility into product sales performance and reporting insights. Use this report to review sales data by product, identify purchasing trends, and better understand store performance over time.
What you can see in the report:
- Product sales
- Revenue data
- Product performance insights
How to access the report
To generate this report:
- Click the Analytics tab.
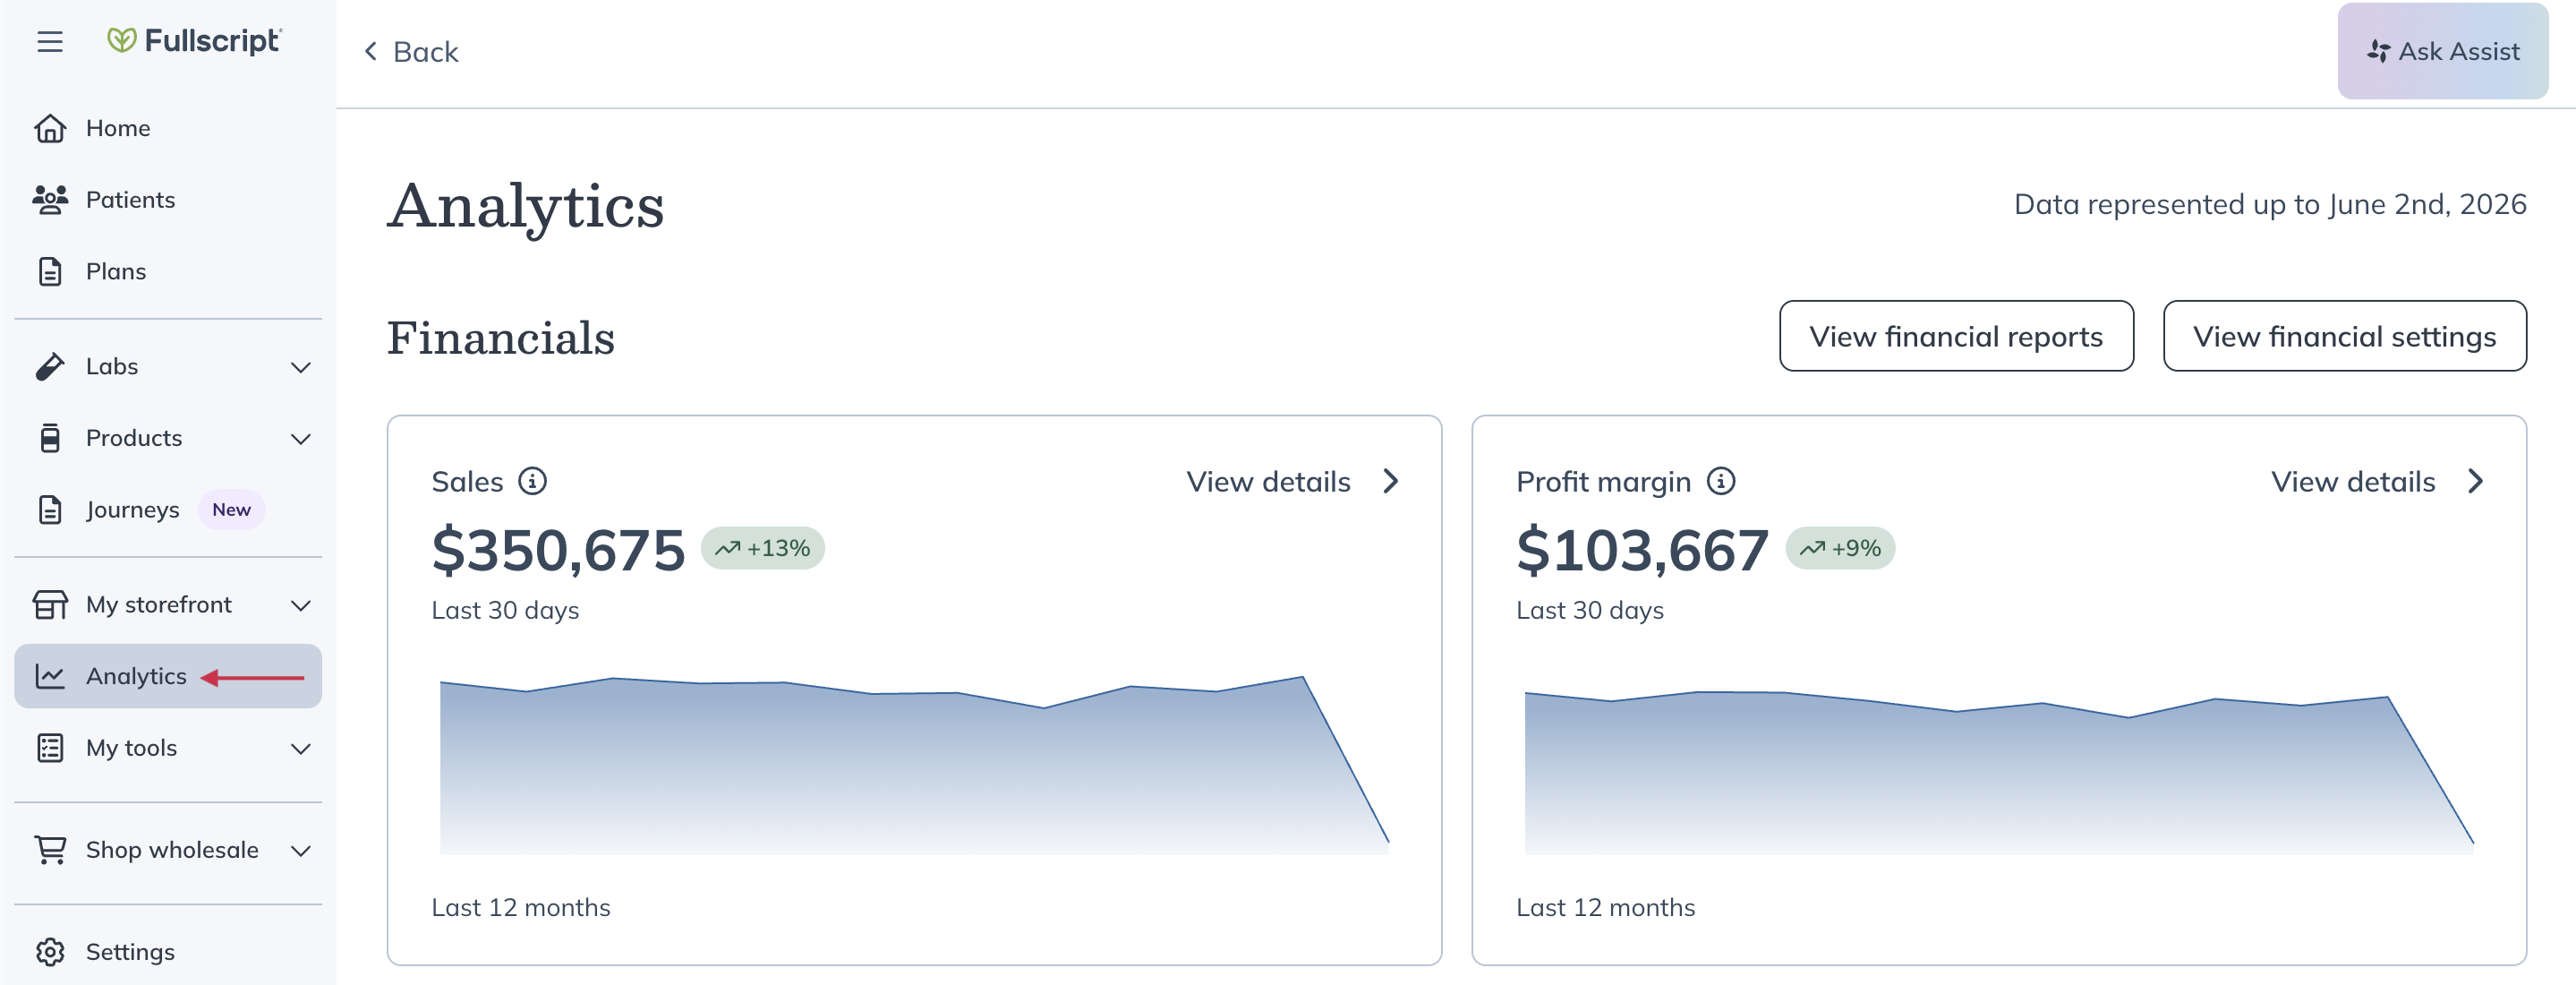
- Select View financial reports.
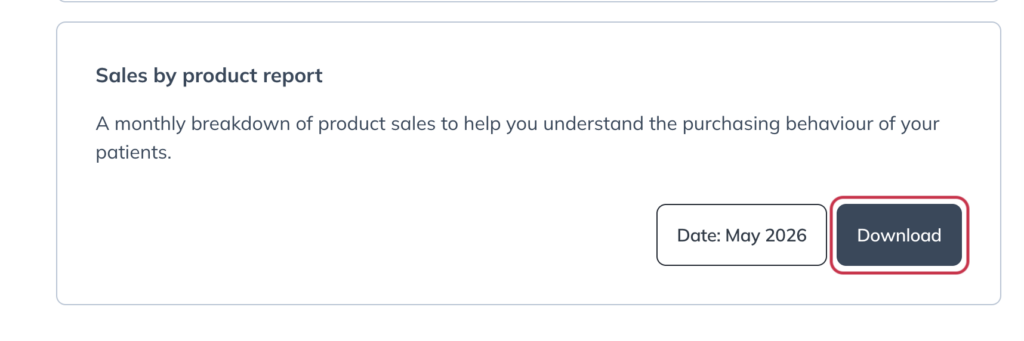
- Scroll down to the Sales by product report heading.
- Select the month you would like the report for.
- Select Download.
Once downloaded, you can open the report to review each product’s sales performance across your store. The report includes rows and columns that help you analyze product sales data, identify trends, and compare performance over time.
Sample report output
The example below shows how data appears in the downloaded Sales by product report. Each row represents a product sold during the selected reporting period.
| Product Name | Brand Name | Variant | Units Sold | Sales | Profit | Reorder Rate (%) |
|---|---|---|---|---|---|---|
| Vitamin D3 | Example Brand | 120 capsules | 15 | $450.00 | $90.00 | 40 |
| Magnesium Glycinate | Example Brand | 180 capsules | 8 | $240.00 | $48.00 | 25 |
| Omega-3 Fish Oil | Example Brand | 90 softgels | 12 | $360.00 | $72.00 | 33 |
This example is provided for illustration purposes. Your report will display products sold during the selected reporting period and may contain additional rows depending on store activity.
Report headings and transaction data
The table below outlines column headings and their descriptions found in the Sales by product report.
| Column headings | Description |
| Product Name | Name of the product sold |
| Brand Name | Brand or manufacturer of the product |
| Variant | Specific variant (e.g., size like “120 capsules”) |
| FS SKU | Fullscript SKU identifier |
| MSRP | Manufacturer’s Suggested Retail Price |
| Units Sold | Total quantity of units sold |
| Sales | Total revenue from what patients actually paid |
| Profit | Earnings/profit made by the practitioner or clinic |
| Plan Units | Units sold through treatment plans |
| MPP Units | Units sold via Managed Patient Plans (MPPs) |
| Self-Serve Units | Units sold via direct patient ordering (self-serve) |
| Re-order Rate | Patients who purchased in the time period, what % ordered more than once |